Data Analytics Training in Hyderabad
Elite Trainers from Esteemed Institutions
Hands-On Learning Through Projects
Comprehensive Course Curriculum
Career-Boosting Support and Guidance
Ignite Your Career with Data Analytics Training! Enroll Now
Data Analytics Training in Hyderabad:
Are you ready to dive into the world of data analytics and harness its potential for informed decision-making? Our Data Analytics Training in Hyderabad program is designed to equip you with the skills and knowledge needed to extract valuable insights from data and drive meaningful outcomes. You will be learning topics like including Excel, SQL, Tableau, Power BI, Python and Statistics and more. One of the key skills we focus on as a part of our course is effectively analyzing large sets of data. As a part of this program, you'll learn how to collect, clean, and analyze large sets of data using industry-leading tools and techniques. These skills are invaluable for businesses looking to make informed decisions based on empirical evidence. By mastering data analysis, you'll be able to uncover valuable insights that can drive strategy and improve business performance. By the end of this Data Analytics Course in Hyderabad program, learners will become fully competent and job-ready experts.
Data Analytics Training in Hyderabad Course Overview:
Our Data Analytics Training in Hyderabad is a comprehensive course that equips students with the skills and knowledge needed to excel in the field of analytics. This course covers a wide variety of topics, including Excel, SQL, Tableau, Power BI, Python and Statistics. Students will learn how to use popular analytics tools such as Python, as well as techniques for analyzing big data sets. One unique aspect of this course is its focus on real-world applications. Students will have the opportunity to work on hands-on projects and case studies that simulate real-life business scenarios. This practical approach allows students to gain valuable experience and apply their knowledge in a meaningful way.
In addition, this program also emphasizes the importance of communication skills. Students will learn how to effectively present their findings and insights to both technical and non-technical audiences. This skill is essential for success in the field of analytics, as it enables professionals to translate complex data into actionable recommendations for businesses. Overall, Analytics Course in Hyderabad program offers a comprehensive curriculum that prepares students for a successful career in analytics. With its focus on real-world applications and emphasis on communication skills, this program provides students with the necessary tools to excel in today's data-driven world.
Course Curriculum
Tableau
- Introduction to Data Visualization & Tableau Connecting to Various Data Sources
- Data Transformations for Analysis
- Unions & Joins
- Common Join Types
- Data Blending
- Live Connections vs. Extracts
- The Sheet Interface
- Dimensions & Measures
- Discrete vs. Continuous
- Sorting Data
- Grouping Data
- Creating Sets
- Defining Hierarchies
- Filters
- Marks Card
4. Creating Charts & Graphs
- Cross Table & Text Table
- Highlight Tables
- Bar Chart
- Stacked Bar Chart
- Line Chart
- Scatter Plot
- Dual Axis & Combined Axis Charts Word
- Cloud
- Funne Chart
- Heat Maps
- Creating Maps etc..
6. Calculated Fields, Table Calculations & Parameters
7. Dashboard & Stories
8. Get Industry Ready
- Create Industry Level Project
- Hands-on experience on various tips & tricks with Tableau Data visualization best practices
- Prepare for Tableau Interview
Microsoft Power BI
- Overview of Power-BI
- Power-BI Platform Types
- Why Power-BI
- Exploring Power-BI
- Power-BI vs Excel
-
Three Components of Power-BI
- Data Connectors
- Connection Modes
- Intro to Power Query
- The Query Editor
- Data QA & Profiling
- Data Cleaning
- Table Transformations
- Calendar Tools
- Combine & Append Queries M
- Language
- Data Modeling 101
- Normalization Facts
- & Dimensions
- Primary & Foreign Keys
- Cardinality
- Filter Flow
- Star & Snowflake Schemas
- Hierarchies
-
Managing Relationships
4. Calculated Fields With DAX
- DAX 101
- Columns & Measures
- Row & Filter Context
- DAX Syntax Common
-
Functions
- Text, Date Functions
- Calculate
- Iterators
-
Time Intelligence
5. Visualising Data
- Data Viz Best Practices
- Formatting & Filtering
- Bookmarks
- Report Interactions
- User Roles
- Parameters Custom
- Tooltips Mobile
- Layouts
- Slicer panels
- Report navigation
- Row-level security
- Optimize reports
- Filtering
- Interaction Controls
- Top N Cards
6. Artificial Intelligence & Optimization tools
- Anomaly Detection
- Smart Narrative Q&A
- Visual Decomposition
- Tree Key Influencers
-
Top Segments
- Optimize Ribbon Pause
- Visuals Optimization
- Presets Apply all Slicers
- Performance Analyzer
-
External Tools
7. Get Industry Ready
- Create Industry Level Project
- Hands-on experience on various tips and tricks with Tableau Data
- visualization best practices
-
Prepare for Tableau Interview
Business Statistics & EDA
- Introduction to Qualitative & Quantitative
- Scales of Measurement – Nominal / Ordinal / Interval / Ratio Types of
- Statistics
-
Descriptive Statistics
- Measures of Central Tendency
- Measures of Dispersion or Spread or Variability
- Measures of Distribution – Shape
- Histogram
- Skewness – Left & Right
- Normal Distribution
6. Inferential Statistics
Inferential Statistics
8. Measures of Association between two continuous variables
EDA Using Matplotlib
2. Data Distributions
3. Outlier Detection and Management
4. Charts & Graphs
5. One Dimensional Charts
6. Histogram
8. Two – Dimensional Charts Bar
9. Charts (Stack & Dodge) Scatter
10. Plots
11. Box Plots
12. Fancy Charts – Bubble Charts, Word Clouds
Python for Data Analytics
2. Types & Data Structures Control
3. Statements
4. Functions
5. User Defined Functions
6. Python Packages
- Numpy
- Pandas
- Matplotlib & Seaborn (Data Visualization)
EXCEL
- Sort
- Filter
- Excel Overview
- Creating a New Workbook
- Navigating in Excel Moving
- the Cell Pointer Using Excel
- Menus
- Previewing & Printing a Worksheet
- Switching Between Sheets in a Workbook
- Inserting & Deleting Worksheets
- Renaming & Moving Worksheets
- Hiding Columns, Rows & Sheets
- Splitting & Freezing a Window
- Inserting Cell Comments
- Editing, Clearing, & Replacing Cell Contents Cutting,
- Copying, & Pasting Cells Moving &
- Copying Cells with Drag and Drop
- Collecting & Pasting Multiple Items Using the Paste Special Command Inserting and Deleting Cells,
- Rows, & Columns Using Undo, Redo
- Checking Your Spelling Finding & Replacing Information
- Using Excel Toolbars: Hiding, Displaying, and Moving Toolbars
-
Entering Values in a Worksheet & Selecting a Cell Range
Formulas
- Creating a Basic Formula
- IF, Nested Ifs
- IFNA, IF
- Error Vlookup
- HLookup
- XLookup
- Sumif & Sumifs
- Countif & Countifs
- Averageif & Averageifs Match
- Index
- Text Functions
- Date Functions
- Editing & Copying Formulas Fixing Errors in Your Formulas
- Formulas with Several Operators and Cell Ranges
Data Analysis & Pivot Tables
- Creating a PivotTable Specifying the Data,
- a PivotTable Analyzes
- Changing a PivotTable's Calculation
- Selecting What Appears in a PivotTable
- Grouping Dates in a PivotTable
- PivotTable Formatting
- Conditional-Formatting
- Data Validation
- Data Consolidation
- Text To Columns
- Remove Duplicates
- Record Macros Pivot
- Chart
-
Slicing
Data Visualization Using EXCEL
- Creating a Chart
- Chart Formatting
- Changing a Chart Type and Working with Pie Charts Adding
- Titles, Gridlines
Get Industry Ready
- Dashboard Building Tips & Tricks Data
- Cleaning Demo
- Sample Project Demo
- Review and Recap
- Final Project: Call Centre Analysis & Apparel Manufacture Analysis
- Conditional-Formatting
- Data Validation
- Data Consolidation
- Text To Columns
- Remove Duplicates
- Record Macros Pivot
- Chart
-
Slicing
SQL
1. Introduction to SQL
- What is SQL
- Overview of the SQL Language SQL
- Database Structure Advantages of
- SQL
2. Data Definition Language (DDL)
to SQL
- Introduction to DDL
- Creating Database and Tables Modifying
- and Deleting Tables
3. Data Manipulation Language (DML)
- Introduction to DML
- Retrieving Data using Select Statement Inserting
- Updating and Deleting data
Basics
- Syntax of Queries Drop
- Database, Tables
- Insert Into, Update, Alter, Truncate, Delete
- Constraints, Primary Key, Foreign Key
- Select Statement
- Commenting Query
- Filtering, Grouping, Sorting & Limiting
Intermediate
- Aggregation
- Group by
- Having
-
Case, Coalesce
- Text Functions
- Date & Time Functions
-
Order Of Execution & Order of Writing
Advanced SQL
- Joins Subqueries
- Common Table
- Expressions (CTE)
- Views
- Temporary Tables
- Stored Procedures and Triggers Advanced
- Query Optimization Window Functions
Get industry Ready
- Review and Recap
-
Final Project: Superstore Sales Analysis
What is Data Analytics?
One key aspect of data analytics is its ability to provide actionable insights that drive business strategy. By utilizing descriptive analytics to understand historical data trends and predictive analytics to forecast future outcomes, organizations can take proactive measures to address challenges or capitalize on emerging opportunities.
Targeted Audience for Data Analytics Course in Hyderabad Program:
- Database People
- Excel Experience
- Statisticians
- Bsc Stats Students
- Mac Stats Students
- Data Warehousing , Business Intelligence
- Market Research Analyst
Microsoft Power BI
- Overview of Power-BI
- Power-BI Platform Types
- Why Power-BI
- Exploring Power-BI
- Power-BI vs Excel
-
Three Components of Power-BI
- Overview of Power-BI
- Power-BI Platform Types
- Why Power-BI
- Exploring Power-BI
- Power-BI vs Excel
-
Three Components of Power-BI
Why Choose Our Data Analytics Training in Hyderabad Course?
Another factor that sets us apart is our focus on industry-relevant skills. We understand that analytics is a rapidly evolving field, and what may be relevant today might become obsolete tomorrow. Therefore, we make sure to update our curriculum regularly, incorporating the latest trends and technologies. This ensures that our students are well-prepared for the current job market and can easily adapt to new challenges. At our institute, we are committed to providing you with the best training experience. Here's what sets our Data Analytics Training apart:
Expert Instructors

Practical Approach

Cutting-Edge Curriculum

Career-Focused
Our training is designed to make you job-ready. From resume building to interview preparation, we provide comprehensive career support to help you stand out in the competitive job market.

Flexible Learning
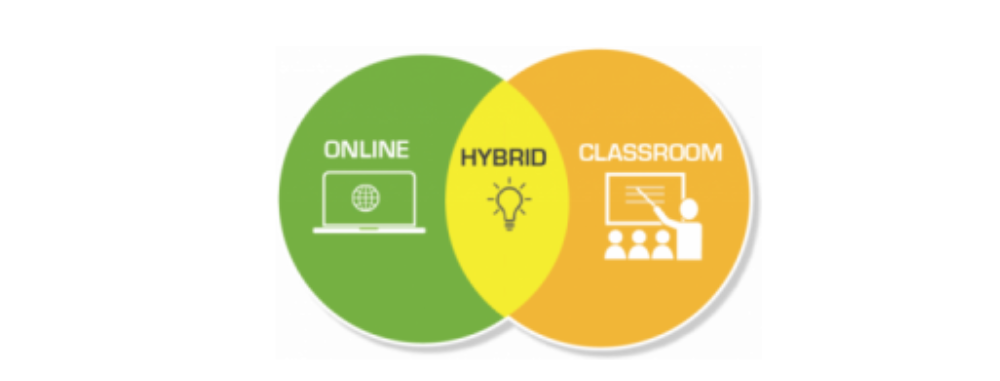
Choose between in-person classes or online sessions, allowing you to tailor your learning experience to your schedule.

Job Opportunities after the Completion of Data Analytics Course Training in Hyderabad
Completion of Data Analytics Training in Hyderabad opens up a world of job opportunities in various industries. With the rise of data-driven decision-making, companies are increasingly seeking professionals who can interpret and analyze large sets of data to provide insights and drive business growth. From finance to marketing, healthcare to retail, opportunities abound for those with strong analytical skills.
With the increasing demand for analytics professionals across all sectors, successful completion of Data Analytics Course in Hyderabad program gives you endless possibilities when it comes to finding employment. Whether as Data Scientists mining valuable insights from vast amounts of information or as Business Analysts guiding organizations towards better decisions through data analysis, the future looks bright for those who take on the challenge of mastering data analytical skills.
Are you ready to take your career to new heights? Enroll in our Data Analytics Training program. Embrace the future of Data Analytical Operations!
Testimonials
Frequently Asked Interview Questions:
As a part of this Data Analytics Course in Hyderabad program, you'll work on real-world projects involving data cleaning, analysis, visualization, and interpretation, providing you with practical experience.
Register For Workshop
About Us
Analytics Path offers intense application-driven & hands-on training programs in Data Science, Artificial Intelligence, Machine Learning & Deep Learning courses. Learn from the industry experts from IIT & IIM alumina.
Menu
Address
Copyright© ANALYTICS PATH SOFT TECH PRIVATE LIMITED. All rights reserved
